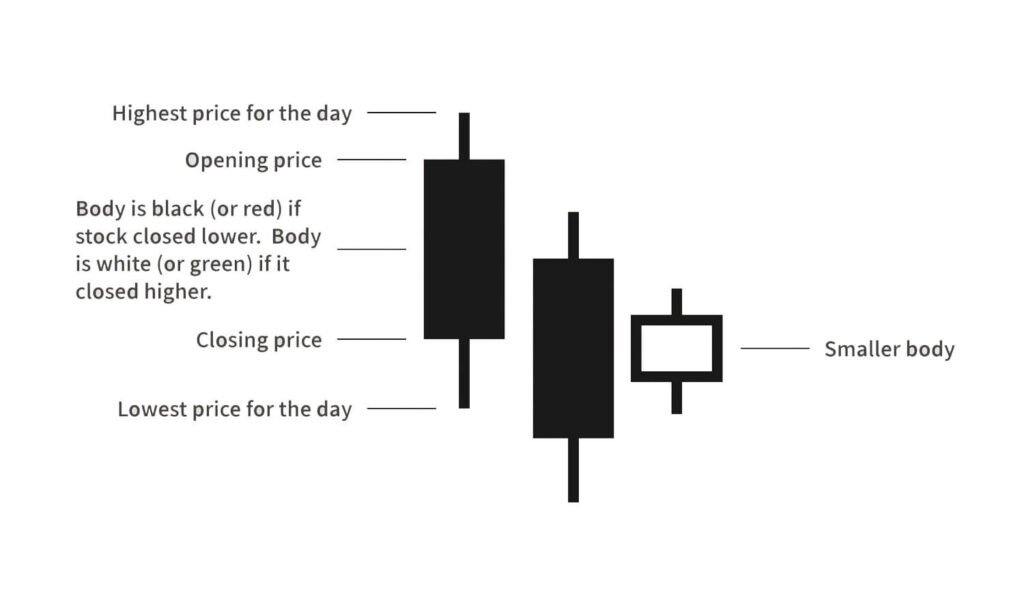
Japanese Candlestick chart is a style of price chart which depict the plotting of the price movement of a security or financial instrument. An individual candle will usually plot the price movement in one of two ways being up or down. A candle that plots price movement in a positive or upward direction is called a Bullish Candle. On other hand, the candle that plots price movement in a negative or downward direction is referred to as a Bearish Candle. You may get confused between dark and light candle bodies, try to remember to look at each as if we were talking about the weather. A dark body has a stormy or bearish overtone and a clear body has a bright or bullish outlook.
Japanese Candlestick chart is a style of price chart which depict the plotting of the price movement of a security or financial instrument. An individual candle will usually plot the price movement in one of two ways being up or down. A candle that plots price movement in a positive or upward direction is called a Bullish Candle. On other hand, the candle that plots price movement in a negative or downward direction is referred to as a Bearish Candle. You may get confused between dark and light candle bodies, try to remember to look at each as if we were talking about the weather. A dark body has a stormy or bearish overtone and a clear body has a bright or bullish outlook.
Candlestick chart may seems a simple price chart at first glance but a careful & investigative look tells the story of tug of war between Buyers & Sellers.
Candlestick chart shows many different types of candles which vary in the size of their bodies & wicks/shadows with each other.
Although every single candle portrays 4 types of price information (as discussed earlier), not every candle has significance in terms of anticipating the future direction of price movement.
There are some candlestick patterns which gives high probable clues/hints of the likely future direction of price movement, are called “Candlestick Patterns”.
They have no value until they appear on significant support & resistance levels.
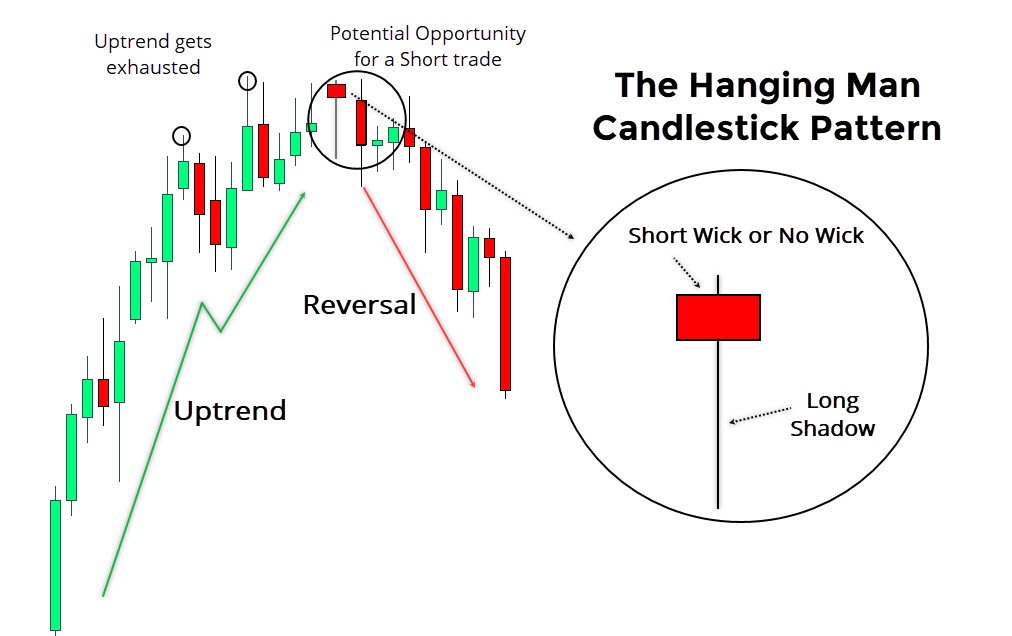
This pattern is made up of three candles with the second (center) candle being a hammer. On the third day, prices decline below the shadow of the previous day’s hammer completing the formation.
We can observe selling coming the day after hammer forms. Remember that a Hammer Candle is bearish at the top of an uptrend.
The buyers are able to regain control and push prices back up towards the opening price or beyond forming the lower shadow and small body of the hammer.
Even though the buyers were still around on the second day the initial selling is seen as a warning the trend may be slowing. The third day’s dark candle is seen as conformation of this warning.


The Bullish Harami reversal signal occurs after a sizeable downtrend. A large black candle forms on the first day, the price gaps up the next morning as buyers step in. They are able to move prices higher all day, but not high enough to overtake the opening price of the previous day’s candle.


The Bullish Harami reversal signal occurs after a sizeable downtrend. A large black candle forms on the first day, the price gaps up the next morning as buyers step in. They are able to move prices higher all day, but not high enough to overtake the opening price of the previous day’s candle.


The Bullish Kicker is a two day reversal pattern that can be extremely strong but sometimes hard to trade.
The Bullish Kicker consists of a bearish dark candle on the first day of the formation that forms after period of falling prices.
The second day should be a very bullish candle that gaps up to open from the close of the previous day’s candle and closes above the high of the first day’s candle.
What makes the Bullish Kicker sometimes difficult to trade is the size of the gap between the first and second day’s candle.
Many times a Bullish Kicker will have a very large gap, sometimes above the open of the second day’s candle. Many times gaps this large will retrace themselves and the price will come back to fill the gap to test it for support.
This makes taking a long position a little tricky sometimes.
The Bearish Kicker is the bearish counterpart to the Bullish Kicker with a kicking or gapping candle.
With the Bearish Kicker we are looking for the pattern to form at the top of a trend and show bearish price action rather than bullish price action at the bottom of a trend.
The Bearish Kicker is a two day reversal pattern that can also be hard to trade for an end of day trader depending of the size of the gap.
After a period of rising prices we look for the pattern to form after a bullish white candle which will be the first day of the pattern.
The second day gaps down to open below the close of the first day’s candle and sells off during the day to close below the open of the first day’s bullish candle.


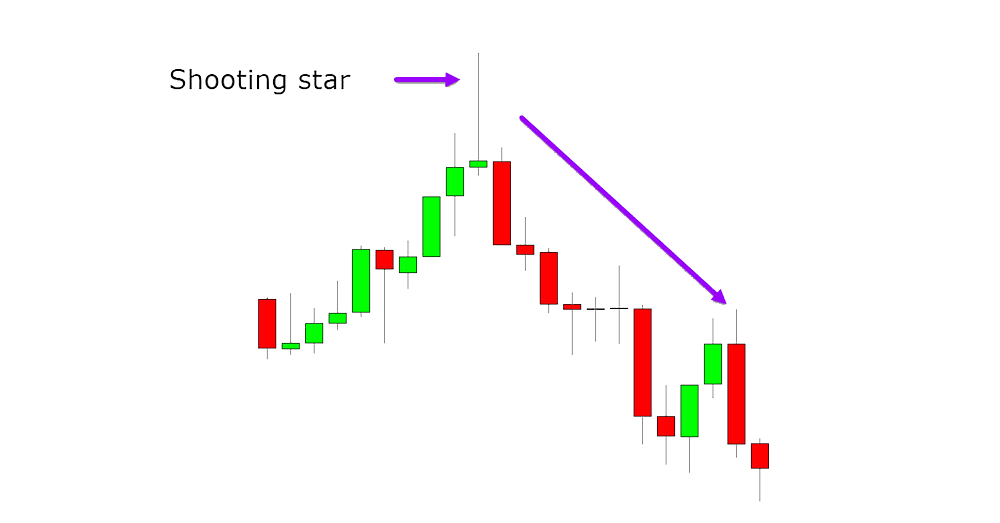
The Shooting Star pattern is a three day pattern consisting of a white (or clear) bodied candle on the first day, followed by a small bodied black or white candle on the second day that gaps up above the first day’s close. The final day of the Shooting Star will complete the pattern with a longer than average black (or filled) candle that gaps down below the body of the second candle, closing well into the body of the first candle of the formation.
After a substantial uptrend, buyers carry prices higher as the first day of the formation reveals itself. At the beginning of the second day there are enough buyers left to cause a gap up in price but demand decreased as sellers move in to take their profits and cause the formation of a candle with little price movement (small body). The third days dark bodied candle forms as the sellers overtake buyers causing an oversupply, prices gap down and quickly decline throughout the day, eliminating most or the entire move of the previous two days.
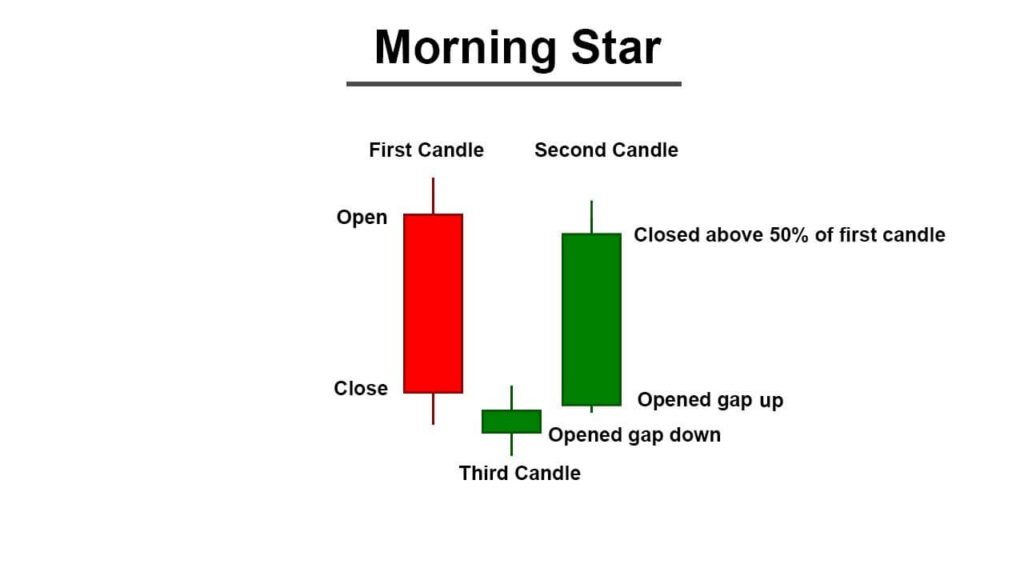
Morning Star is a three day reversal pattern that starts off with a dark candle on the first day, followed by a black or white candle that gaps down in price but trades into the range of the first day’s candle (shadow).
The final day of the formation reveals a white candle gapping up in price and closed well into the range of the candle of the first day.
After a substantial downtrend, the first days candle reveals strong selling. On the second day sellers open the day lower but are losing steam as buyers step in and absorb the supply of stock causing a small trading range for the day.
The third day reveals buyers taking control as demand for the stock increases dramatically, causing the last candle to trade well into the body of the first day’s candle and wiping out losses for the period.


Evening Star is a three day pattern that consists of a longer than average white (or clear) bodied candle on the first day followed by a smaller black or clear candle that gaps up to open above the close of the first day.
The third candle is a longer than average black (or filled) bodied candle that gaps down to open below the body of the second candle and trades well into the body of the first candle.
While the bodies of all three candles may be separated from one another, the trading range of all three days will trade into one another which are represented by the shadows.
After a substantial uptrend in price buyers carry prices higher on a very bullish day completing the first day’s candle. The following day buyers are still strong enough to open above the close but sellers comes in and supply & demand even out causing the small bodied candle on the second day. The third and final day of the pattern reveals the demand at current prices has dried up and sellers step in causing prices to sell off.
Prices plummet throughout the day well into the body of the first candle, eating up much of the gains of the last three days.

