Japanese Candlestick chart is a style of price chart which depict the plotting of the price movement of a security or financial instrument. An individual candle will usually plot the price movement in one of two ways being up or down. A candle that plots price movement in a positive or upward direction is called a Bullish Candle. On other hand, the candle that plots price movement in a negative or downward direction is referred to as a Bearish Candle. You may get confused between dark and light candle bodies, try to remember to look at each as if we were talking about the weather. A dark body has a stormy or bearish overtone and a clear body has a bright or bullish outlook.
Japanese Candlestick chart is a style of price chart which depict the plotting of the price movement of a security or financial instrument. An individual candle will usually plot the price movement in one of two ways being up or down. A candle that plots price movement in a positive or upward direction is called a Bullish Candle. On other hand, the candle that plots price movement in a negative or downward direction is referred to as a Bearish Candle. You may get confused between dark and light candle bodies, try to remember to look at each as if we were talking about the weather. A dark body has a stormy or bearish overtone and a clear body has a bright or bullish outlook.
Candlestick chart may seems a simple price chart at first glance but a careful & investigative look tells the story of tug of war between Buyers & Sellers.
Candlestick chart shows many different types of candles which vary in the size of their bodies & wicks/shadows with each other.
Although every single candle portrays 4 types of price information (as discussed earlier), not every candle has significance in terms of anticipating the future direction of price movement.
There are some candlestick patterns which gives high probable clues/hints of the likely future direction of price movement, are called “Candlestick Patterns”.
They have no value until they appear on significant support & resistance levels.
Japanese Candlestick chart is a style of price chart which depict the plotting of the price movement of a security or financial instrument. An individual candle will usually plot the price movement in one of two ways being up or down. A candle that plots price movement in a positive or upward direction is called a Bullish Candle. On other hand, the candle that plots price movement in a negative or downward direction is referred to as a Bearish Candle. You may get confused between dark and light candle bodies, try to remember to look at each as if we were talking about the weather. A dark body has a stormy or bearish overtone and a clear body has a bright or bullish outlook.

Japanese Candlestick chart is a style of price chart which depict the plotting of the price movement of a security or financial instrument. An individual candle will usually plot the price movement in one of two ways being up or down. A candle that plots price movement in a positive or upward direction is called a Bullish Candle. On other hand, the candle that plots price movement in a negative or downward direction is referred to as a Bearish Candle. You may get confused between dark and light candle bodies, try to remember to look at each as if we were talking about the weather. A dark body has a stormy or bearish overtone and a clear body has a bright or bullish outlook.


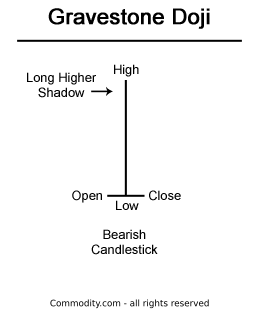
The Gravestone Doji shows price action that opens and closed at the bottom of its daily range giving the bears a slight upper hand for the day. The Gravestone Doji can be considered very bearish at a top or at levels of technical resistance.
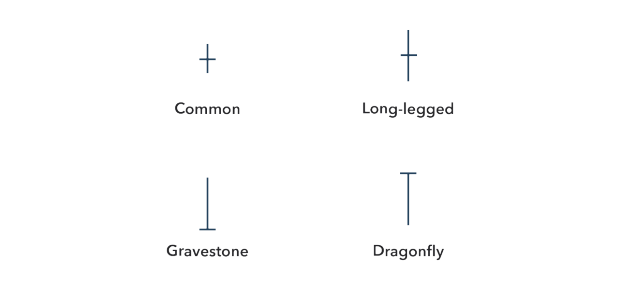
The Dragonfly Doji Shows price action for the day that
finishes at the top of its daily trading range giving the Bulls
the slight upper hand for the day. The Dragonfly Doji is a very
bullish candle when forming at a bottom.
The Long Legged doji is a doji that could have either a very
long shadow on the top or bottom of the body of the candle.
The Long Legged doji signifies extreme uncertainty between
buyers and sellers on that specific trading day.


The Hammer is a single candle that also represents a possible change in trend direction, similar to the Doji.
The Hammer also has a couple of variations in shape.
A hammer has a long daily range compared to the difference between the closing and opening price.
The Hammer will have either a white or black body, with the white body being somewhat more bullish or a dark body being slightly more bearish.
The significance of a Hammer candle is its long shadow compared to the size of its body. It depicts either buyers or sellers started the day off moving prices their desired direction.
Once prices moved up or down a significant amount, depending whether the initial pressure was selling or buying, the opposite side got the upper hand and were able to push prices the other direction which may show the force of the trend was weakening.
A Hammer can have either bullish or bearish overtones depending were it forms. If prices were moving in an uptrend, the length of the shadow warns of selling pressure.
Even though the bulls were able to push prices back to the top of the daily range, the fact that they had to tells us the trend may be weakening.
The reverse is true if the hammer forms at the bottom of a downtrend.


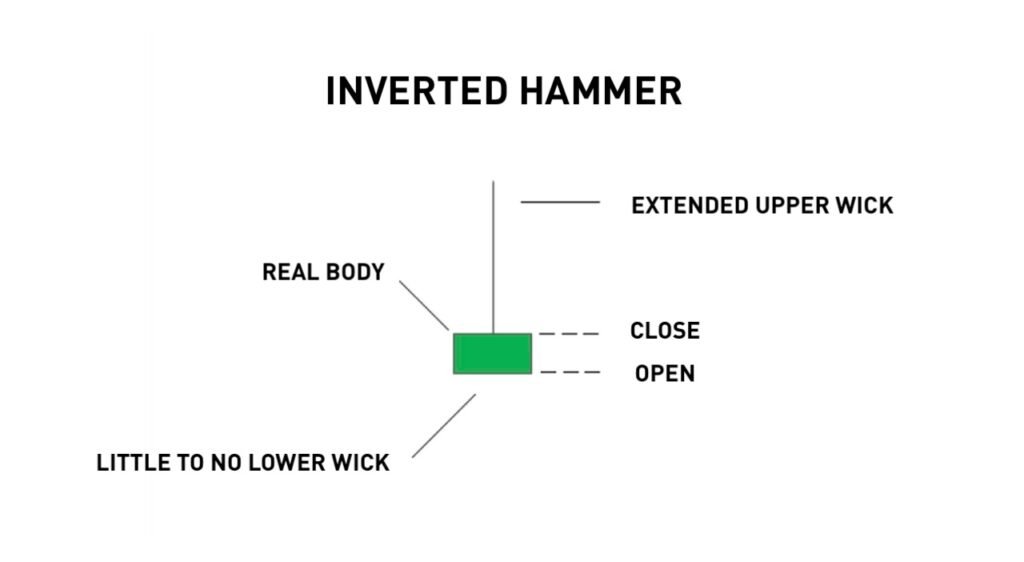
Inverted hammer usually has the same psychological implications as a traditional hammer.
When we find the inverted hammer at the top of a trend it can give us a very bearish signal.
After the bulls have moved prices in an uptrend, the day of the inverted hammer will signal that at the beginning of the trading day the bulls continued moving prices higher but were met with stiff resistance from sellers.
The bears were able to push prices back down close to the opening price leaving the upper shadow. The longer the upper shadow gives us a more bearish signal in this situation.
When we find the inverted hammer at the bottom of a trend it will signify buyers beginning to enter the market. While the prices have been moving lower for a period of time, buyers enter on the day of the hammer pushing prices higher.
Even though the bears were able to push prices back down leaving the upper shadow, the fact that they had to gives a very bullish signal and we would begin to look for signs of a reversal.


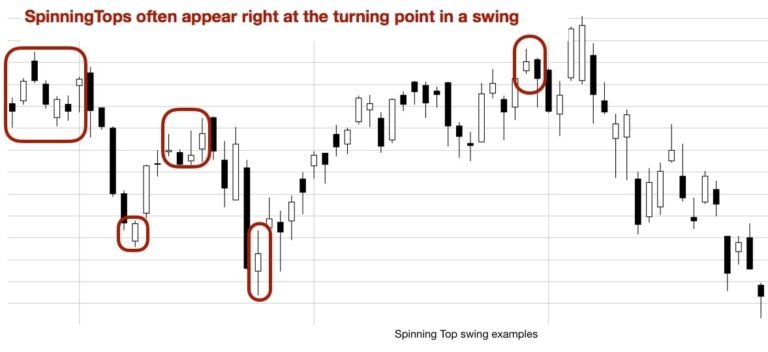
Spinning tops are candles that have a small body compared to the size of the shadows.
Spinning top must have long shadows at both ends of the body.
Spinning tops may or may not offer information depending on their place on a chart.
In a market that is trending sideways a spinning top can usually be considered neutral.
However, after a big move in price in either direction a spinning top can have the same reversal implications as the Doji on a level of support/resistance or forms within a few days of a Doji.


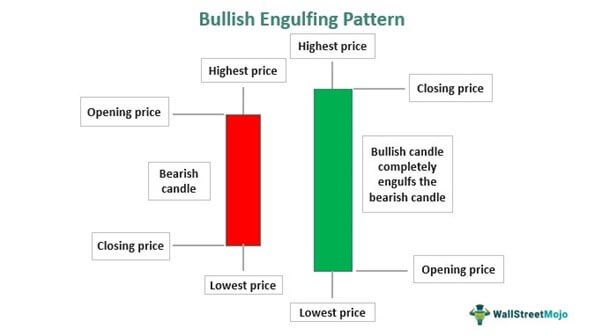
The Bullish Engulfing formation is a very strong bullish two day reversal signal.
The Bullish Engulfing pattern consists of a black candle on the first day with the price gapping down on the second day, opening lower than the close of the first day.
The price then rallies and the clear candle of the second day closes higher than the first day’s opening price completely engulfing the first day’s body. A look at the psychology behind this formation reveals the sellers or the supply declining as prices move lower.
When the price gaps down on the second day, buyers begin entering with force.
The pattern reveals a change in investor sentiment from selling to buying.


The Bearish Engulfing reversal pattern is made up of a clear body the first day and a dark body on the second.
On the first day a white body forms and on the second day price drops and closes lower than the open of the first day completely engulfing the body of the first day’s candle.
We look for this formation in an overbought market to signal us of a major change in investor psychology.
After a good strong uptrend, the engulfing candle of the second day shows heavy selling in a larger proportion to the buying of the first day.
The Bullish Piercing pattern, also referred to a Piercing Line, is a two day formation that consists of a longer than average black candle on the first day followed by a white candle that rebounds to close into the body of the first candle.
This pattern forms in a very bearish climate after a significant downtrend with the long black candle of the first day demonstrating heavy selling and fear. The long shadow on the second day indicates fear is still present, but throughout the second day selling dries up and buyers come in with vigor sending prices back into the body of the first day’s candle. Even though this is a very strong reversal signal it should be confirmed by the following day’s candle.

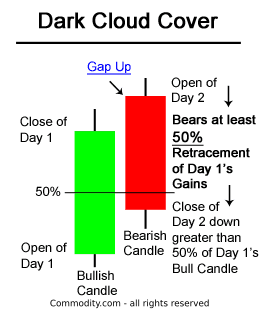
Dark Cloud formation is the bearish counterpart of the Bullish Piercing pattern. This two day reversal formation is made up of a white (or clear) body on the first day, followed by a dark candle on the second day that gaps up and comes back down into the body of the first day’s candle. While the Dark Cloud is a strong reversal signal, confirmation is required by the next day’s candle to determine its strength.
The Dark Cloud pattern forms after a substantial uptrend has been in place. On the first day’s white candle buying has peaked. The small number of buyers that are left the next morning cause the price to gap up above the close of the first day and sellers begin to step in bringing prices back down into the body of the first day’s candle.

