There are two major approaches to analyze the markets for trading:
Technical Analysis in an approach to anticipate the market directions by analyzing the trends & historical patterns using many different tools. Markets are repetitive in nature up to some extent, so these trends & historical patterns can be traded when they emerge.
Fundamental Analysis is an approach to anticipate the direction through careful study of current economical conditions of the countries in question by analyzing their Key Performance Economic Indicators released by different departments in different time frequencies.
There are two major approaches to analyze the markets for trading:
Technical Analysis in an approach to anticipate the market directions by analyzing the trends & historical patterns using many different tools. Markets are repetitive in nature up to some extent, so these trends & historical patterns can be traded when they emerge
Fundamental Analysis is an approach to anticipate the direction through careful study of current economical conditions of the countries in question by analyzing their Key Performance Economic Indicators released by different departments in different time frequencies.
Trending Markets
Non-Trending Markets
Trending Markets
Non-Trending Markets
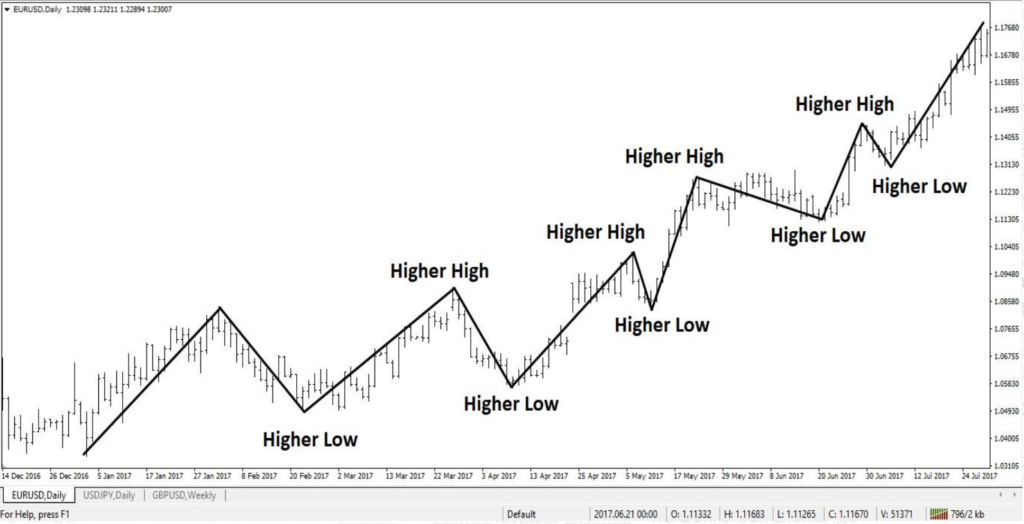
Trending Markets
Non-Trending Markets

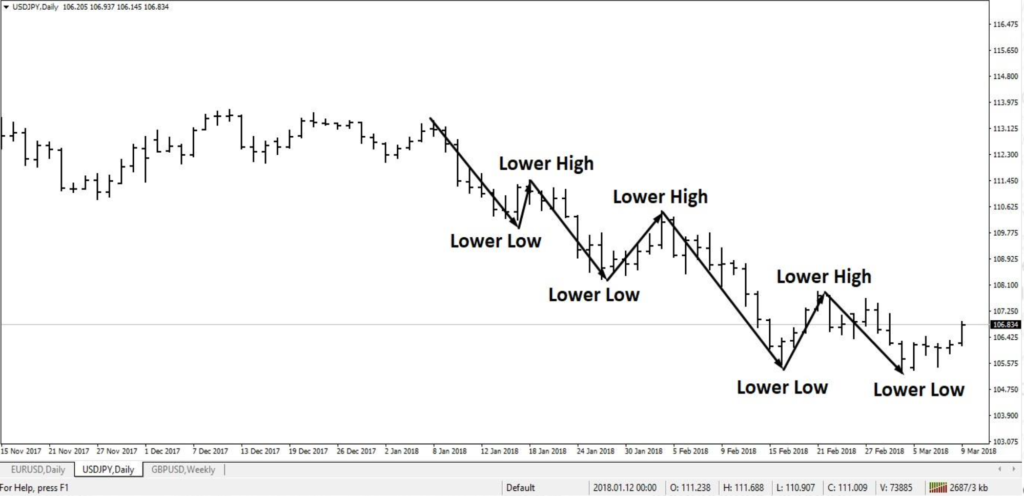

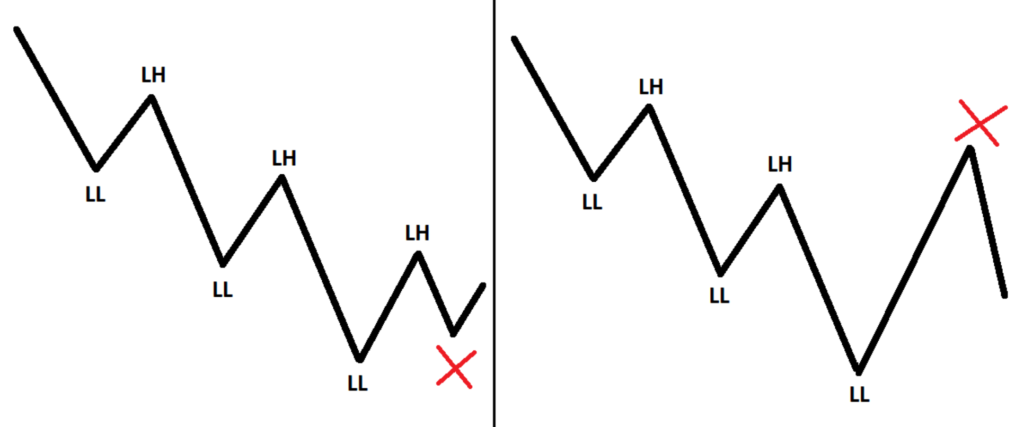


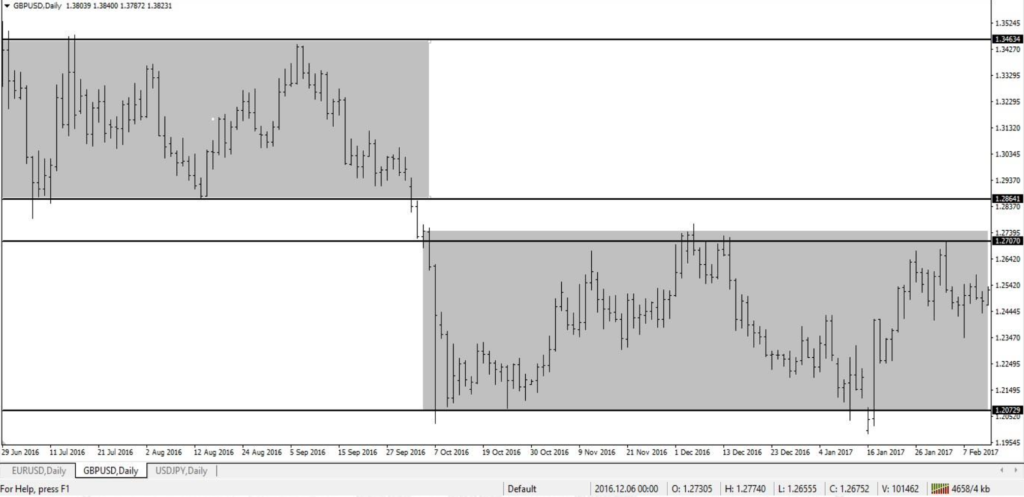

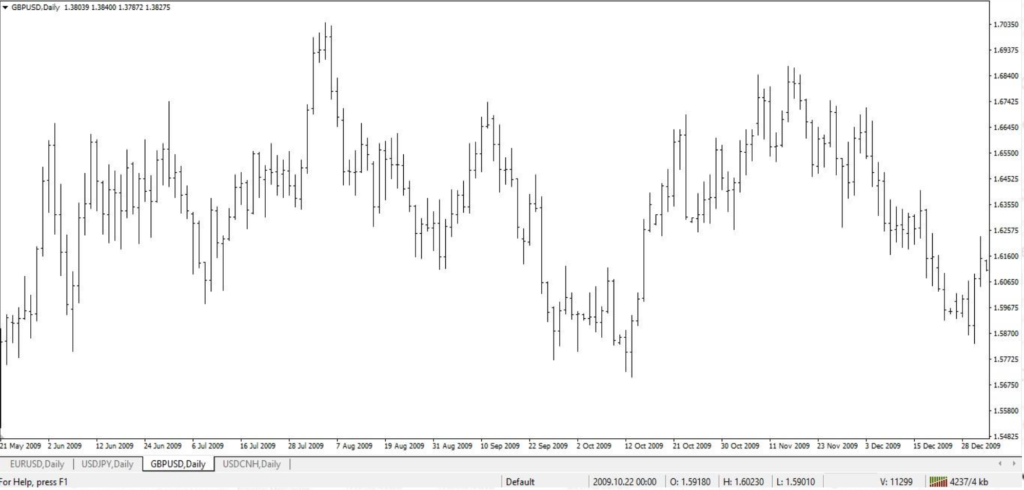


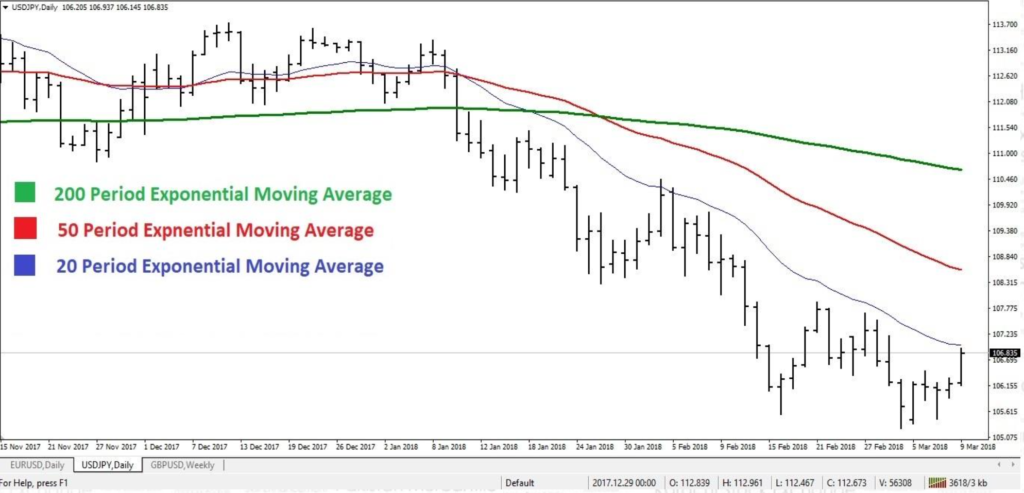

Ideal markets conditions to trade are the trending markets because they are easier to identify & anticipate and make much more money than any other market conditions.
Ranging markets needs lot of experience to trade & required different strategies / methods than the trending markets.
Volatile markets are the toughest market conditions to trade, even for the trader who has vast experience. Its nearly impossible to make money in these market conditions.

They are the horizontal levels on charts, which are the most important part in Technical Analysis and included in almost every strategy or method. Support & Resistance levels in higher time frames are considered much stronger (harder to break) than the ones in lower time frames.
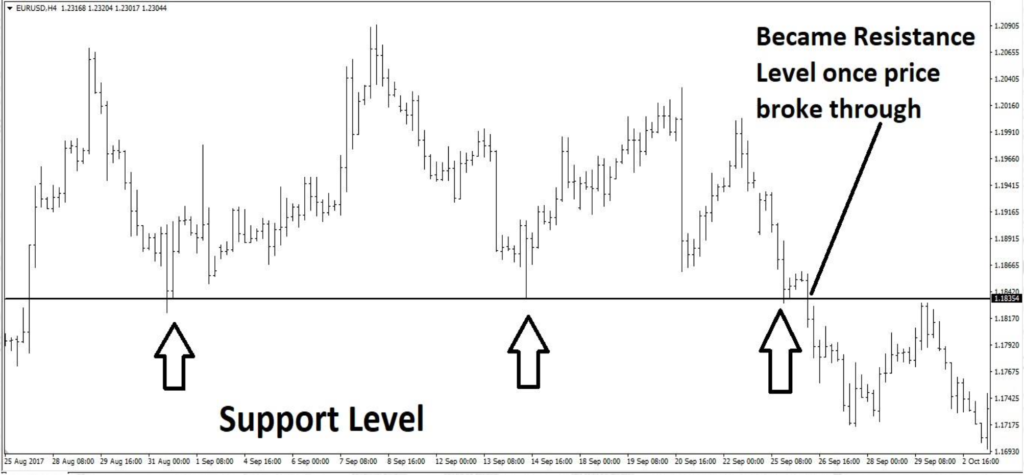
It acts as floor to price. Price tends to bounce from it due to presence of heavy buy orders from different market participants. A support level is considered stronger if touch by price, three times. Once price breaks through, it becomes a resistance level.
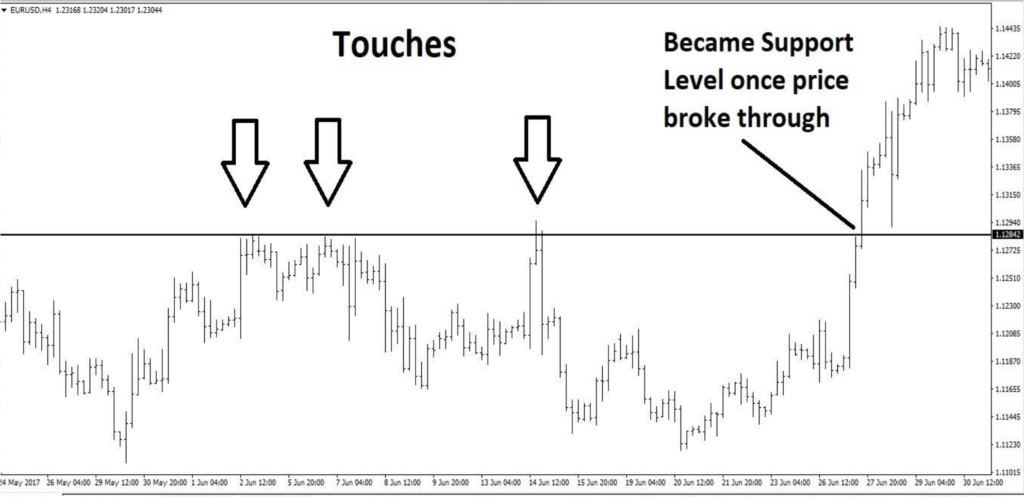
It acts as ceiling to price. Price tends to come off from it due to presence of heavy sell orders from different market participants. A resistance level is considered stronger if touch by price, three times. Once price breaks through, it becomes a support level.

Ideal markets conditions to trade are the trending markets because they are easier to identify & anticipate and make much more money than any other market conditions.
Ranging markets needs lot of experience to trade & required different strategies / methods than the trending markets.
Volatile markets are the toughest market conditions to trade, even for the trader who has vast experience. Its nearly impossible to make money in these market conditions.
They are the horizontal levels on charts, which are the most important part in Technical Analysis and included in almost every strategy or method. Support & Resistance levels in higher time frames are considered much stronger (harder to break) than the ones in lower time frames.
It acts as floor to price. Price tends to bounce from it due to presence of heavy buy orders from different market participants. A support level is considered stronger if touch by price, three times. Once price breaks through, it becomes a resistance level.
It acts as ceiling to price. Price tends to come off from it due to presence of heavy sell orders from different market participants. A resistance level is considered stronger if touch by price, three times. Once price breaks through, it becomes a support level.
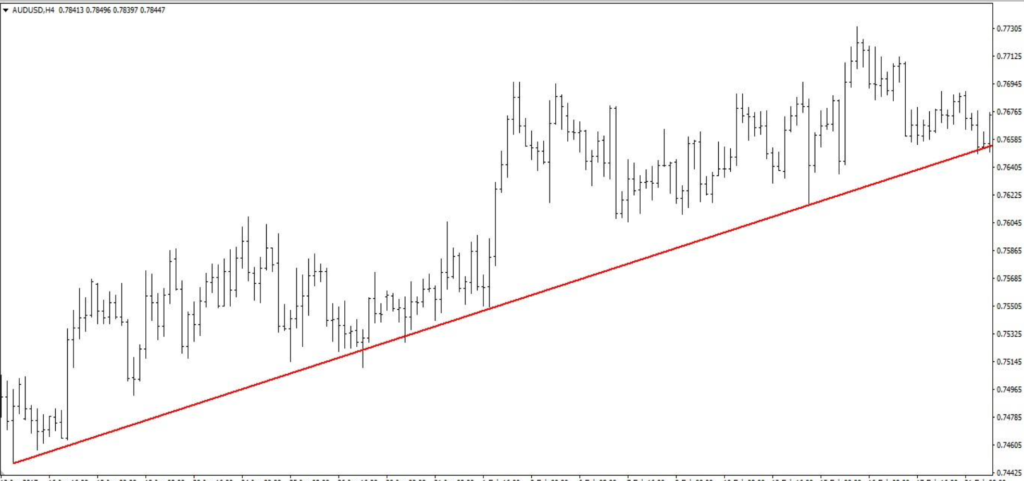
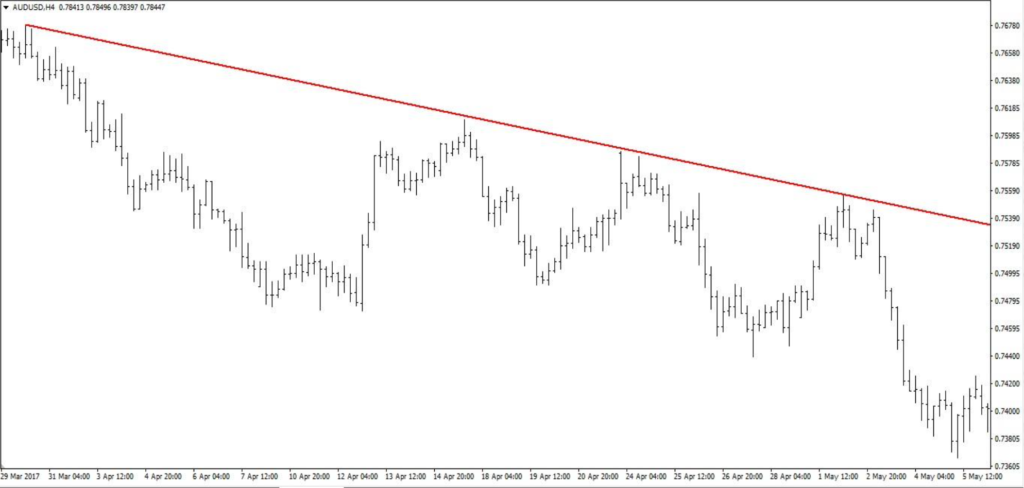
Trendlines are considered diagonal support & resistance. They are used in conjunction with horizontal support & resistance levels to determine the confluence area where price has high probabilities to turn. Trendlines are drawn below the price action in Uptrend & above price action in Downtrend. Similar to horizontal support & resistance levels, three or more touches makes a strong trendline.
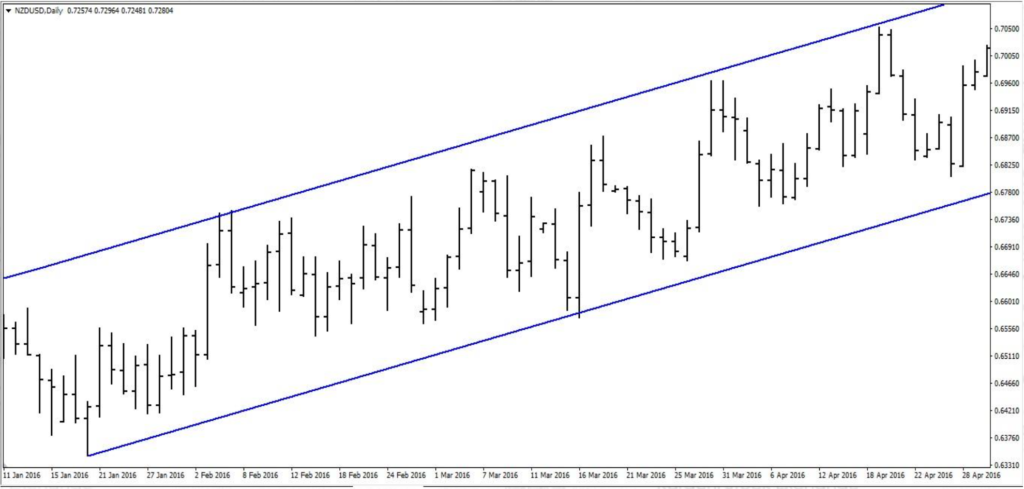
Tend Channel is a diagonal channel followed by price. There is a separate tool in MT4 for Trend Channel so it should NOT be drawn with trendline tool. The general rule of application of this tool is first two lows & an intervening high in Uptrend and first two highs & an intervening low in Downtrend.


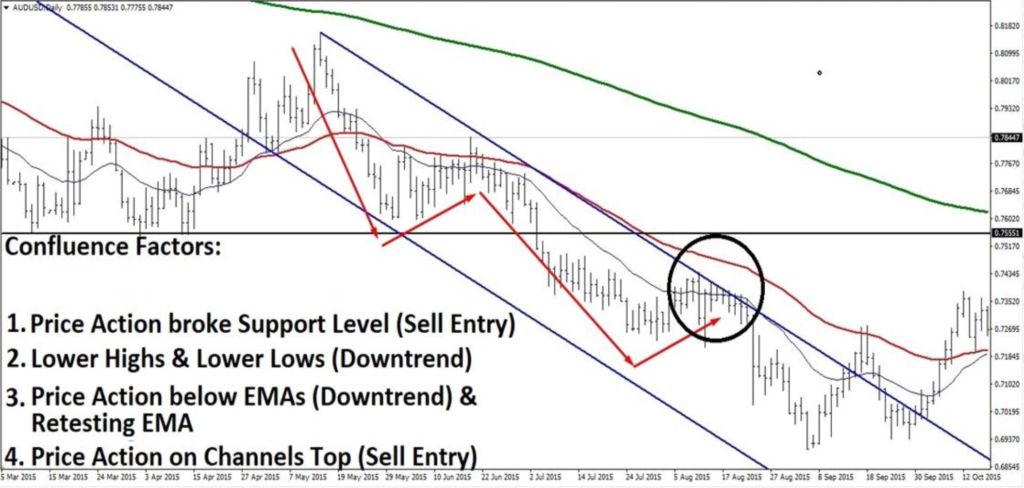
This is a short term move against the trend direction. It takes place when large player / market participants takes the profit on their trades. Amateur traders usually enter in the move when pullback or retracement starts which cost them money.
In order to make money, traders MUST wait for pullback or retracement in trending market, then look for confluence of different factors e.g.
Retest of EMAs
Break of Support & Resistance Levels Retesting Trendline or Trend Channel


Find the Support & Resistance Levels.

