Technical Indicators are used as an aid to the basic technical analytical tools e.g. HH/HL-LH/LL, Support & Resistance Levels, Moving Averages, Trendlines & Trend Channels.
Following Technical Indicators are most commonly used ones:
Technical Indicators are used as an aid to the basic technical analytical tools e.g. HH/HL-LH/LL, Support & Resistance Levels, Moving Averages, Trendlines & Trend Channels.
Following Technical Indicators are most commonly used ones:
Oscillator is a tool used in technical analysis which is banded between two extreme values. The financial instrument is considered overbought in short term when oscillator value crosses the upper extreme & oversold when its crosses lower extreme. They are more useful when there is no clear trend & price starts ranging or moving sideways as it starts giving misleading signals once price break out from range.
Oscillator works like an index, it measures the percentage of the closing price relative to a given period range against 0 – 100 scale. They should be use in conjunction with other technical analysis & indicators when they confirm an established range.
The most common oscillators are Relative Strength Index (RSI), Stochastic, Money Flow Index (MFI) & Price Rate of Change (ROC) etc.
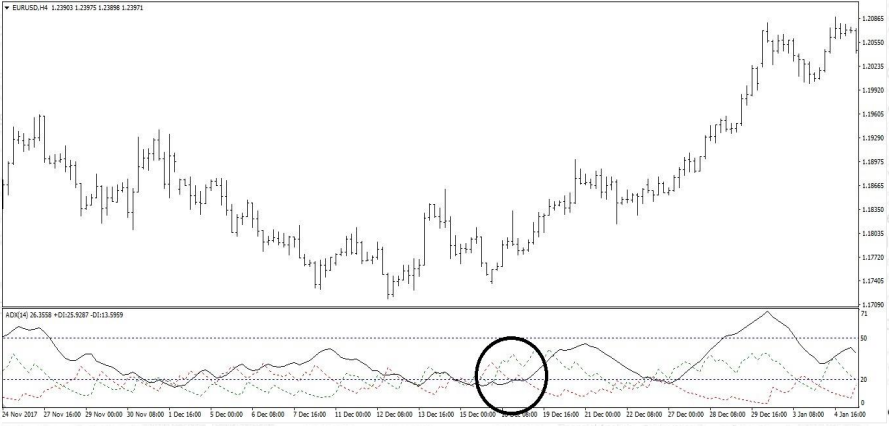
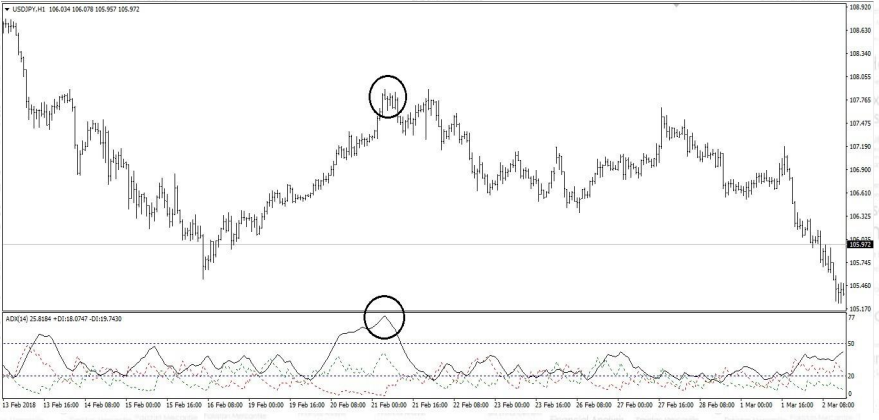
Average Directional Movement Index was developed by Mr. J. Welles Wilder in 1978. It is used to measure/quantify the strength of a trend, not the direction. Its clearly tells us when there is no trend, strong trend or exhausted trend. The associated Directional Movement Indicators tells us when bulls or bears are in
control.
ADX Value < 20 = No Trend
ADX Value > 20 & increasing = Trend is getting strength
ADX Value > 50 = Trend has Exhausted & about to reverse
(a representative exhaustion value can be selected by back-testing exhaustion values in past & taking their mean, which would be particular to that time frame & financial instrument).
Directional Movement Indicators
+DI > -DI = Bulls are in control
-DI > +DI = Bears are in control


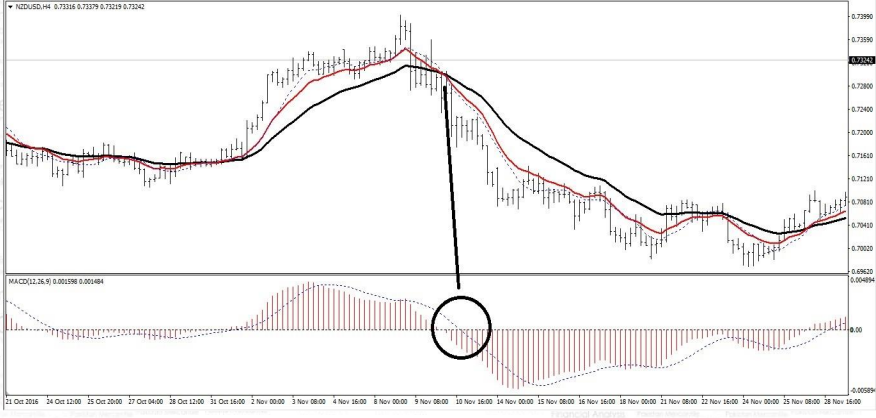
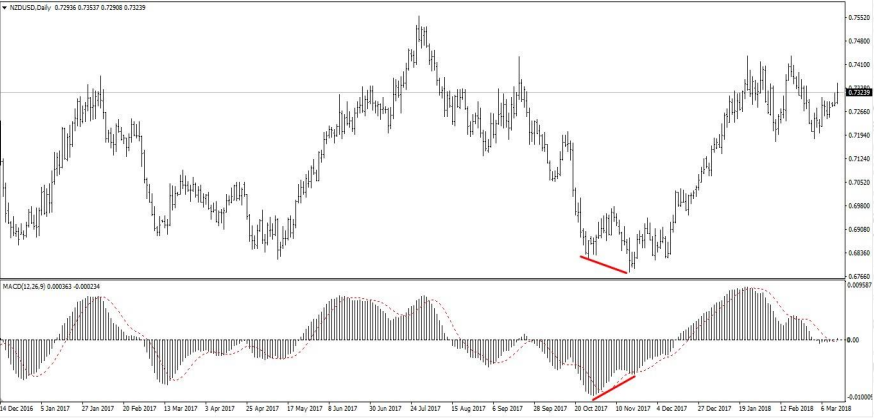
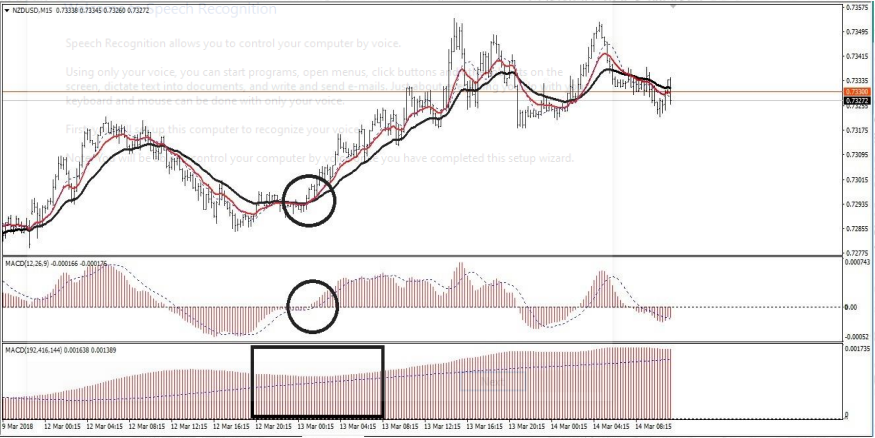
This indicator is developed by Gerald Appel in late seventies. Its uses 26, 12 period of exponential moving averages EMA’s & 9 period of simple moving averages SMA.
MACD can be used for both trend continuation & trend reversal opportunities.
This indicator is developed by Gerald Appel in late seventies. Its uses 26, 12 period of exponential moving averages EMA’s & 9 period of simple moving averages SMA.
MACD can be used for both trend continuation & trend reversal opportunities.








This is a momentum indicator developed by Mr. J. Welles Wilder. Its measure the speed and change of price movement. This indicator is used for following two purposes.
Over-Bought / Over-Sold
This indicator uses two level 30 & 70. Price is considered over-sold when it below 30 & considered over-bought when its above 70.
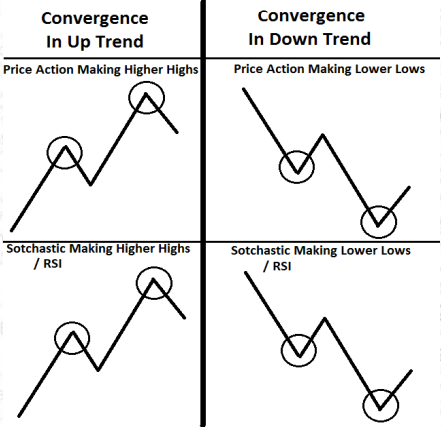
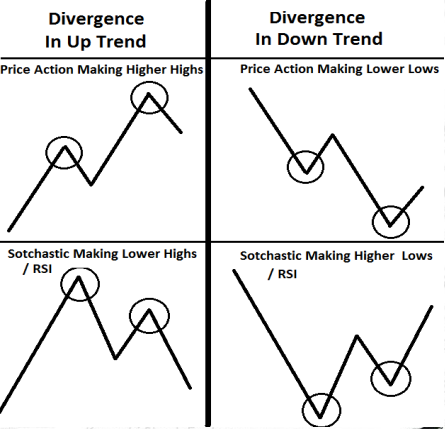
Convergence & Divergence
It give convergence indication on successful swings while gives divergence indication on fail swings which is an excellent signal of trend reversal.
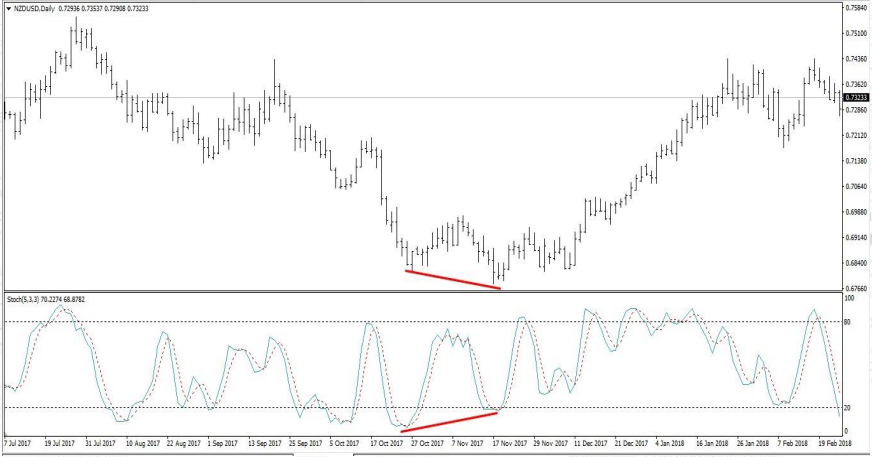
Its also a momentum indicator developed by Dr. George Lane in 1950.
Over-Bought / Over-Sold
This indicator uses two level 20 & 80. Price is considered over-sold when it below 20 & considered over-bought when its above 80.
Convergence & Divergence
It give convergence indication on successful swings while gives divergence indication on fail swings which is an excellent signal of trend reversal.
This is a momentum indicator developed by Mr. J. Welles Wilder. Its measure the speed and change of price movement. This indicator is used for following two purposes.
Over-Bought / Over-Sold
This indicator uses two level 30 & 70. Price is considered over-sold when it below 30 & considered over-bought when its above 70.
Convergence & Divergence
It give convergence indication on successful swings while gives divergence indication on fail swings which is an excellent signal of trend reversal.
Its also a momentum indicator developed by Dr. George Lane in 1950.
Over-Bought / Over-Sold
This indicator uses two level 20 & 80. Price is considered over-sold
when it below 20 & considered over-bought when its above 80.
Convergence & Divergence
It give convergence indication on successful swings while gives divergence indication on fail swings which is an excellent signal of trend
reversal.


