Technical Indicators

Technical Indicators

Learning Outcomes

Commodity Channel Index (CCI) (CCI) (CCI) Oscillator

Commodity Channel Index (CCI) oscillator is a momentum based technical trading tool that was developed by Donald Lambert and featured in Commodities magazine in 1980.

Lambert originally developed CCI to identify cyclical turns in commodities, but the indicator can be successfully applied to indices, ETFs, stocks, and other securities. It is used to identify a new trend or warn of extreme conditions. It measures the change in an instrument’s price relative to a pre-defined moving average (MA) of the price divided by 1.5% of mean deviation from that average. Lambert set the constant at .015 to ensure that approximately 70 to 80 percent of CCI values would fall between -100 and +100.

CCI is relatively high when prices are far above their average. CCI is relatively low when prices are far below their average. In this manner, CCI can be used to identify overbought and oversold levels.
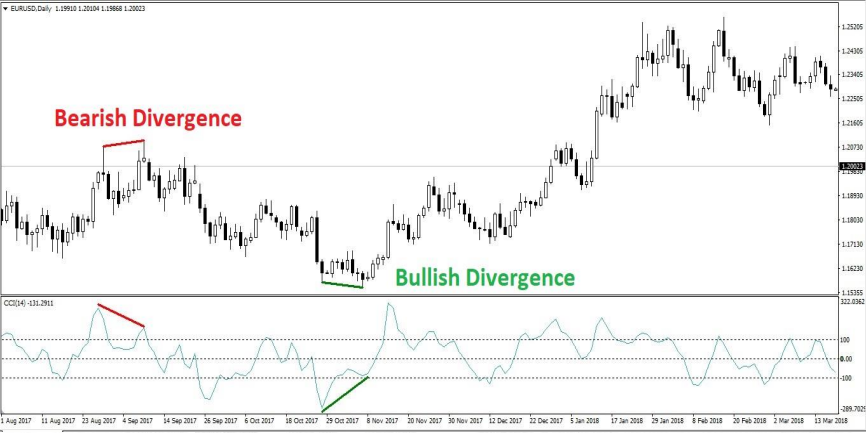
Bearish & Bullish CCI CCI CCI Divergence

Bearish & Bullish CCI CCI CCI Divergence

CCI CCI CCI Improvisation

CCI CCI CCI Improvisation

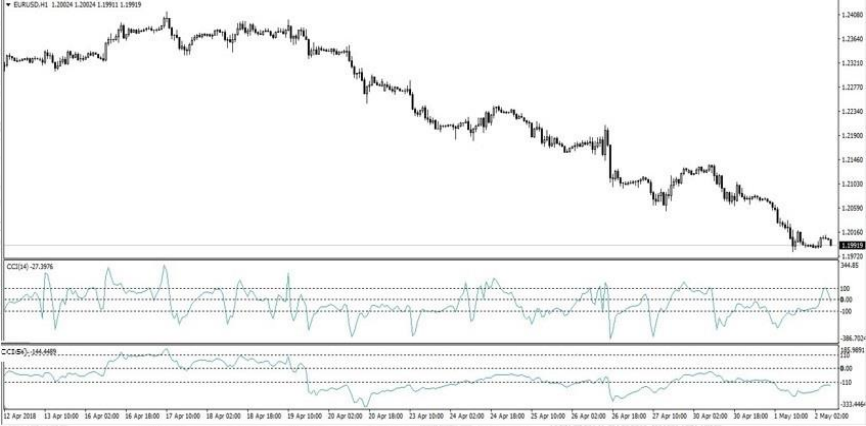
Analysing The High Probable Opportunity With CCI CCI CCI Multiple In Time Frames

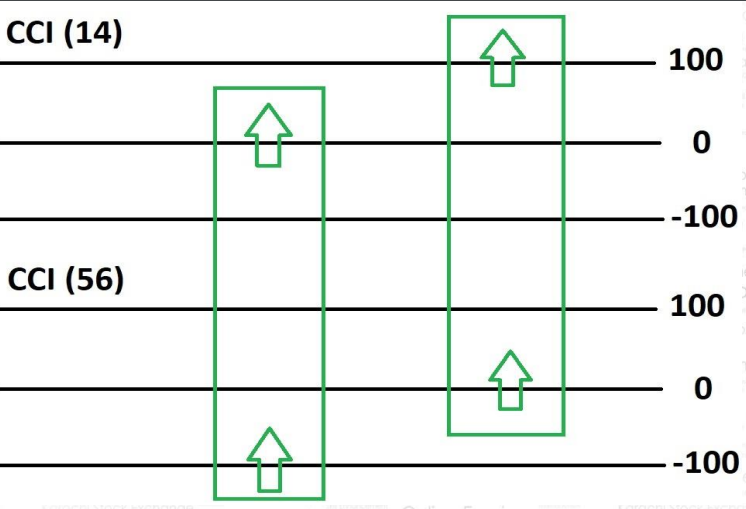
Market is Bullish

  1. When CCI (56) goes above -100 from below & CCI (14) goes above 0 from below.
  2. When CCI (56) goes above 0 from below & CCI (14) goes above 100 from below

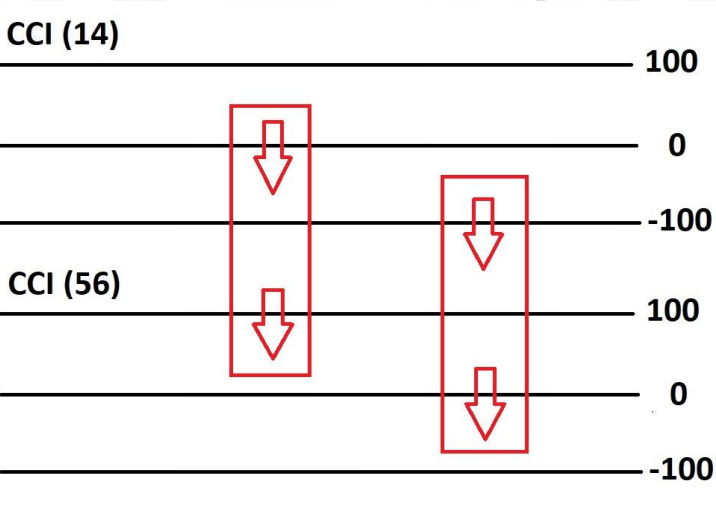
Market is Bearish

  1. When CCI (56) goes below 100 from above & CCI (14) goes below 0 from above.
  2. When CCI (56) goes below 0 from above & CCI (14) goes below -100 from above.

Pivot Points Pivot Points Pivot Points Improvisation

A pivot point is a technical analysis indicator which determine the overall trend of the market. The pivot point itself is simply the average of the high, low and closing price from the previous trading day. Further three Support levels (S1, S2 & S3) and three Resistance levels (R1, R2 & R3) are added to this technical analysis indicator to make it more productive in terms of taking entries & exits.

Trading above the pivot point is thought to indicate ongoing bullish sentiment, while trading below the pivot point indicates bearish sentiment.

Usually Pivot Points are calculated using previous day candle but weekly & monthly Pivot Points can be calculated using previous Week’s & previous Month’s candle for analysis to take swing positions or longer term investments.

How To calculate Standard Pivot Point Pivot Point Pivot Point

Third resistance (R3) = High + 2(PP – Low)
Second resistance (R2) = PP + (High – Low)
First resistance (R1) = (2 x PP) – Low

Pivot point (PP) = (High + Low + Close) / 3

First support (S1) = (2 x PP) – High
Second support (S2) = PP – (High – Low)
Third support (S3) = Low – 2(High – PP)

Note: Some indicators of charting software plots the mid points which are mini levels.

Other Pivot Point Pivot Point Pivot Point Calculations

Weighted Pivot Point

R2 = PP + High – Low
R1 = (2 X PP) – Low
PP = (H + L + 2C) / 4
S1 = (2 X PP) – High
S2 = PP – High + Low

Median Pivot Point

R2 = PP + High – Low
R1 = (2 X PP) – Low
PP = (H + L) / 2
S1 = (2 X PP) – High
S2 = PP – High + Low

How To Use Pivot Point Pivot Point Pivot Point To Gauge Market’s Directional Bias

Bullish:

  • If price open above the pivot point line.
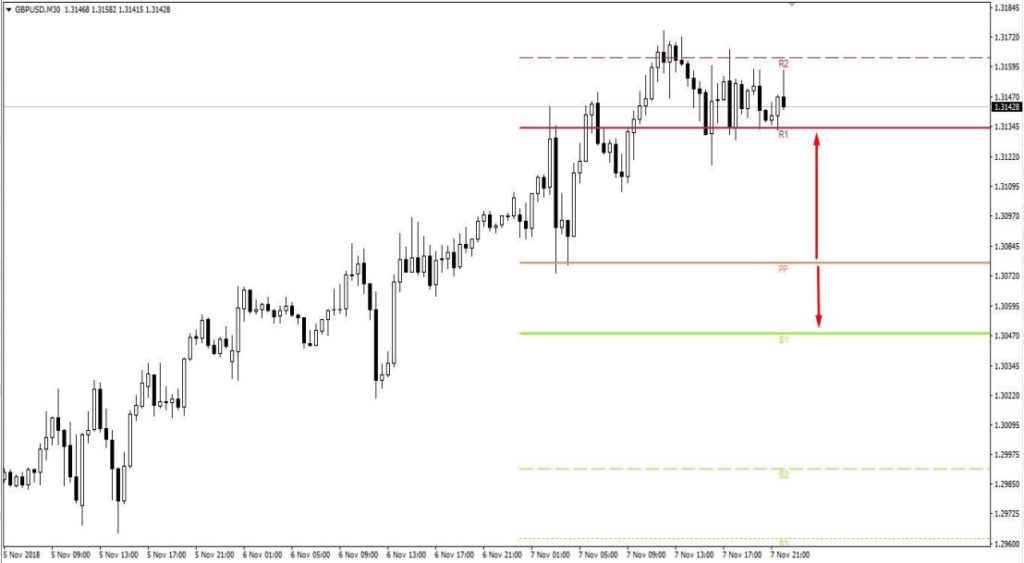
  • The area from pivot point line to R1 is greater than area from pivot point line to S1.
  • Ideally there should be at least one complete cycle (Higher High/Higher Low) in the background & mark the resistance level for profit potential.
  • Entry can be taken on bouncing on pivot point line, SL 5 pips below S1 & TP 5 pips below R1.


BEARISH

  • If price open below the pivot point line.
  • The area from pivot point line to S1 is greater than area from pivot point line to R1.
  • Ideally there should be at least one complete cycle (Lower High/Lower Low) in the
    background & mark the support level for profit potential.
  • Entry can be taken on retesting on pivot point line, SL 5 pips above R1 & TP 5 pips above S1.


Using Pivot Point Pivot Point Pivot Point For Trading Breakouts

If market is trending aggressively in higher time frames.

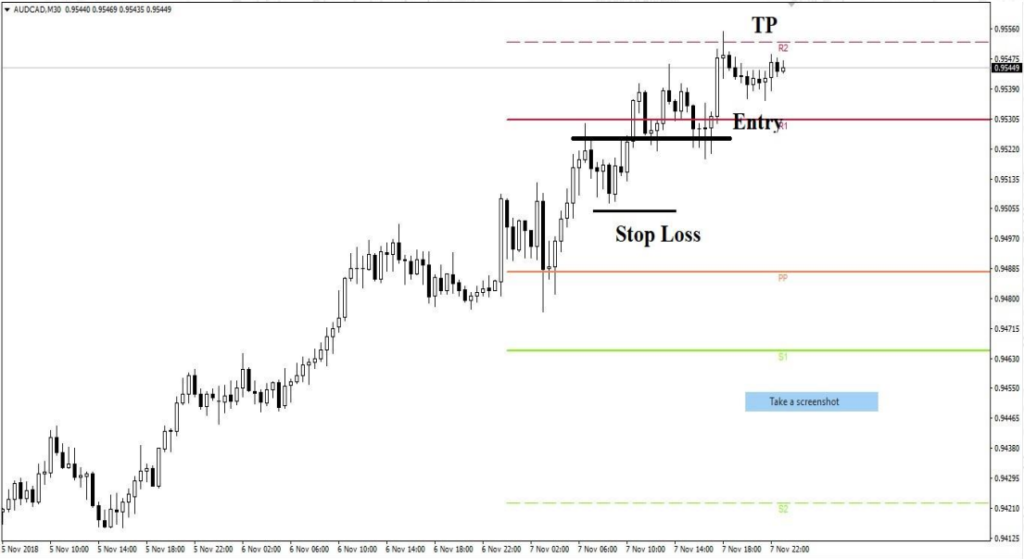
Bullish Entry:

  • Let the price breakout & retest R1 to take entry, previous low for stop loss & R2/R3 (which even is aligning with a horizontal resistance) as TP.

Bearish Entry:

  • Let the price breakdown & retest S1 to take entry, previous high for stop loss & S2/S3 (which even is aligning with a horizontal support) as TP.

Using Pivot Point Pivot Point Pivot Point For Trading Ranging Markets

If market is ranging in higher time frames

Bullish Entry:

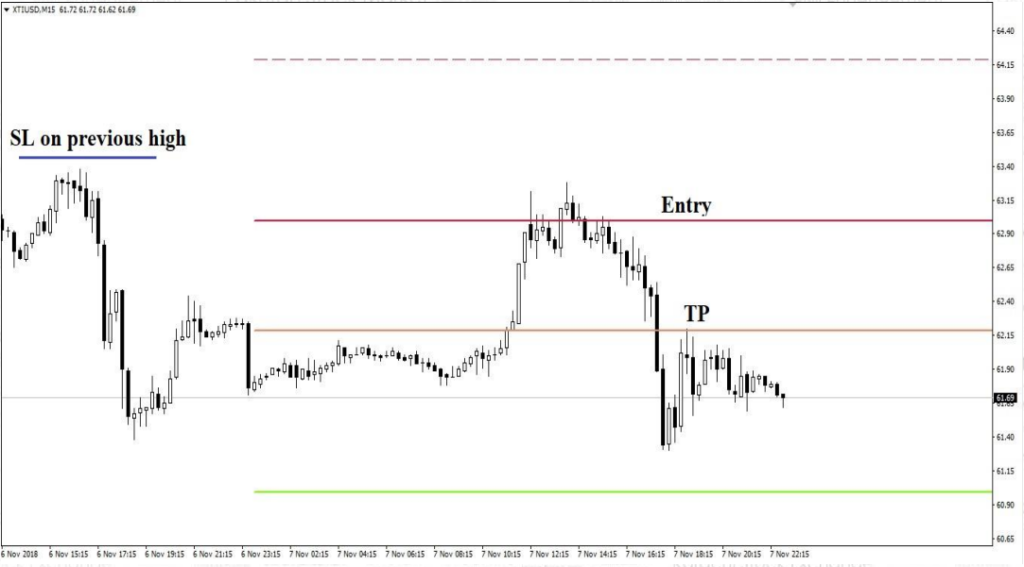
  • Use S1 for entry, S2 or previous high for stop loss & Pivot Point line as TP.
  • For entry, try to find price action reversal pattern/candlestick reversal pattern in smaller time frames.

Bearish Entry:

  • Use R1 for entry, R2 or previous low for stop loss & Pivot Point line as TP.
  • • For entry, try to find price action reversal pattern/candlestick reversal pattern in smaller time frames.

Average True Range  (ATR)  (ATR)  (ATR)

It calculates the average price movement in any time frame & a useful indicator in deciding to the profit taking in running trade.

Daily Time Frame: If in daily time frame, current movement of price achieved or crossed ATR figure, it becomes an early indication that price movement has done for the day so its time to take profit.

Intra-Day Time Frame: ATR x 5 is taken as the take profit level.

Exercise Exercise Exercise

  • Find out the Bullish & Bearish Divergences in CCI.
  • Detect the opportunities with Double CCI Improvised Techniques.
  • Calculate the different types of Pivot Points manually.
  • Gauge the Market Bias with Pivot Points.
  • Practice the Breakouts & Range Trading with Pivot Point.
  • Set the targets as per ATR projections.

Analysis Checklist Analysis Checklist Analysis Checklist

  • Check high impact news (red) on Forex Factory or DailyFX.
  • Mark Horizontal Support & Resistance Levels on Daily & H4 time frames.
  • Analyze the market condition in three different time frames (e.g. Daily, H4 & H1), using Basic Technical Analysis.
  • If market is between Support & Resistance level then you may find a trend continuation opportunity if there is a trending market. With the help of Pivot Point BREAK & RETEST strategy (OR BREAKOUT strategy incase of aggressive trending).
  • If market is near to a strong Support or Resistance Level, you should be looking for Trend Reversal
    opportunity with the help of Divergence in CCI.
  • If market is ranging, you can find opportunities with Pivot Point Range Trading Strategy with the
    help of overbought/oversold zones of CCI.
  • If market breaks any horizontal support & resistance level then ideal trade would be BREAK & RETEST.
  • It would be ideal to take trade after a Candlestick Pattern & set target as per ATR.